Lesson 2: Climate Stripes
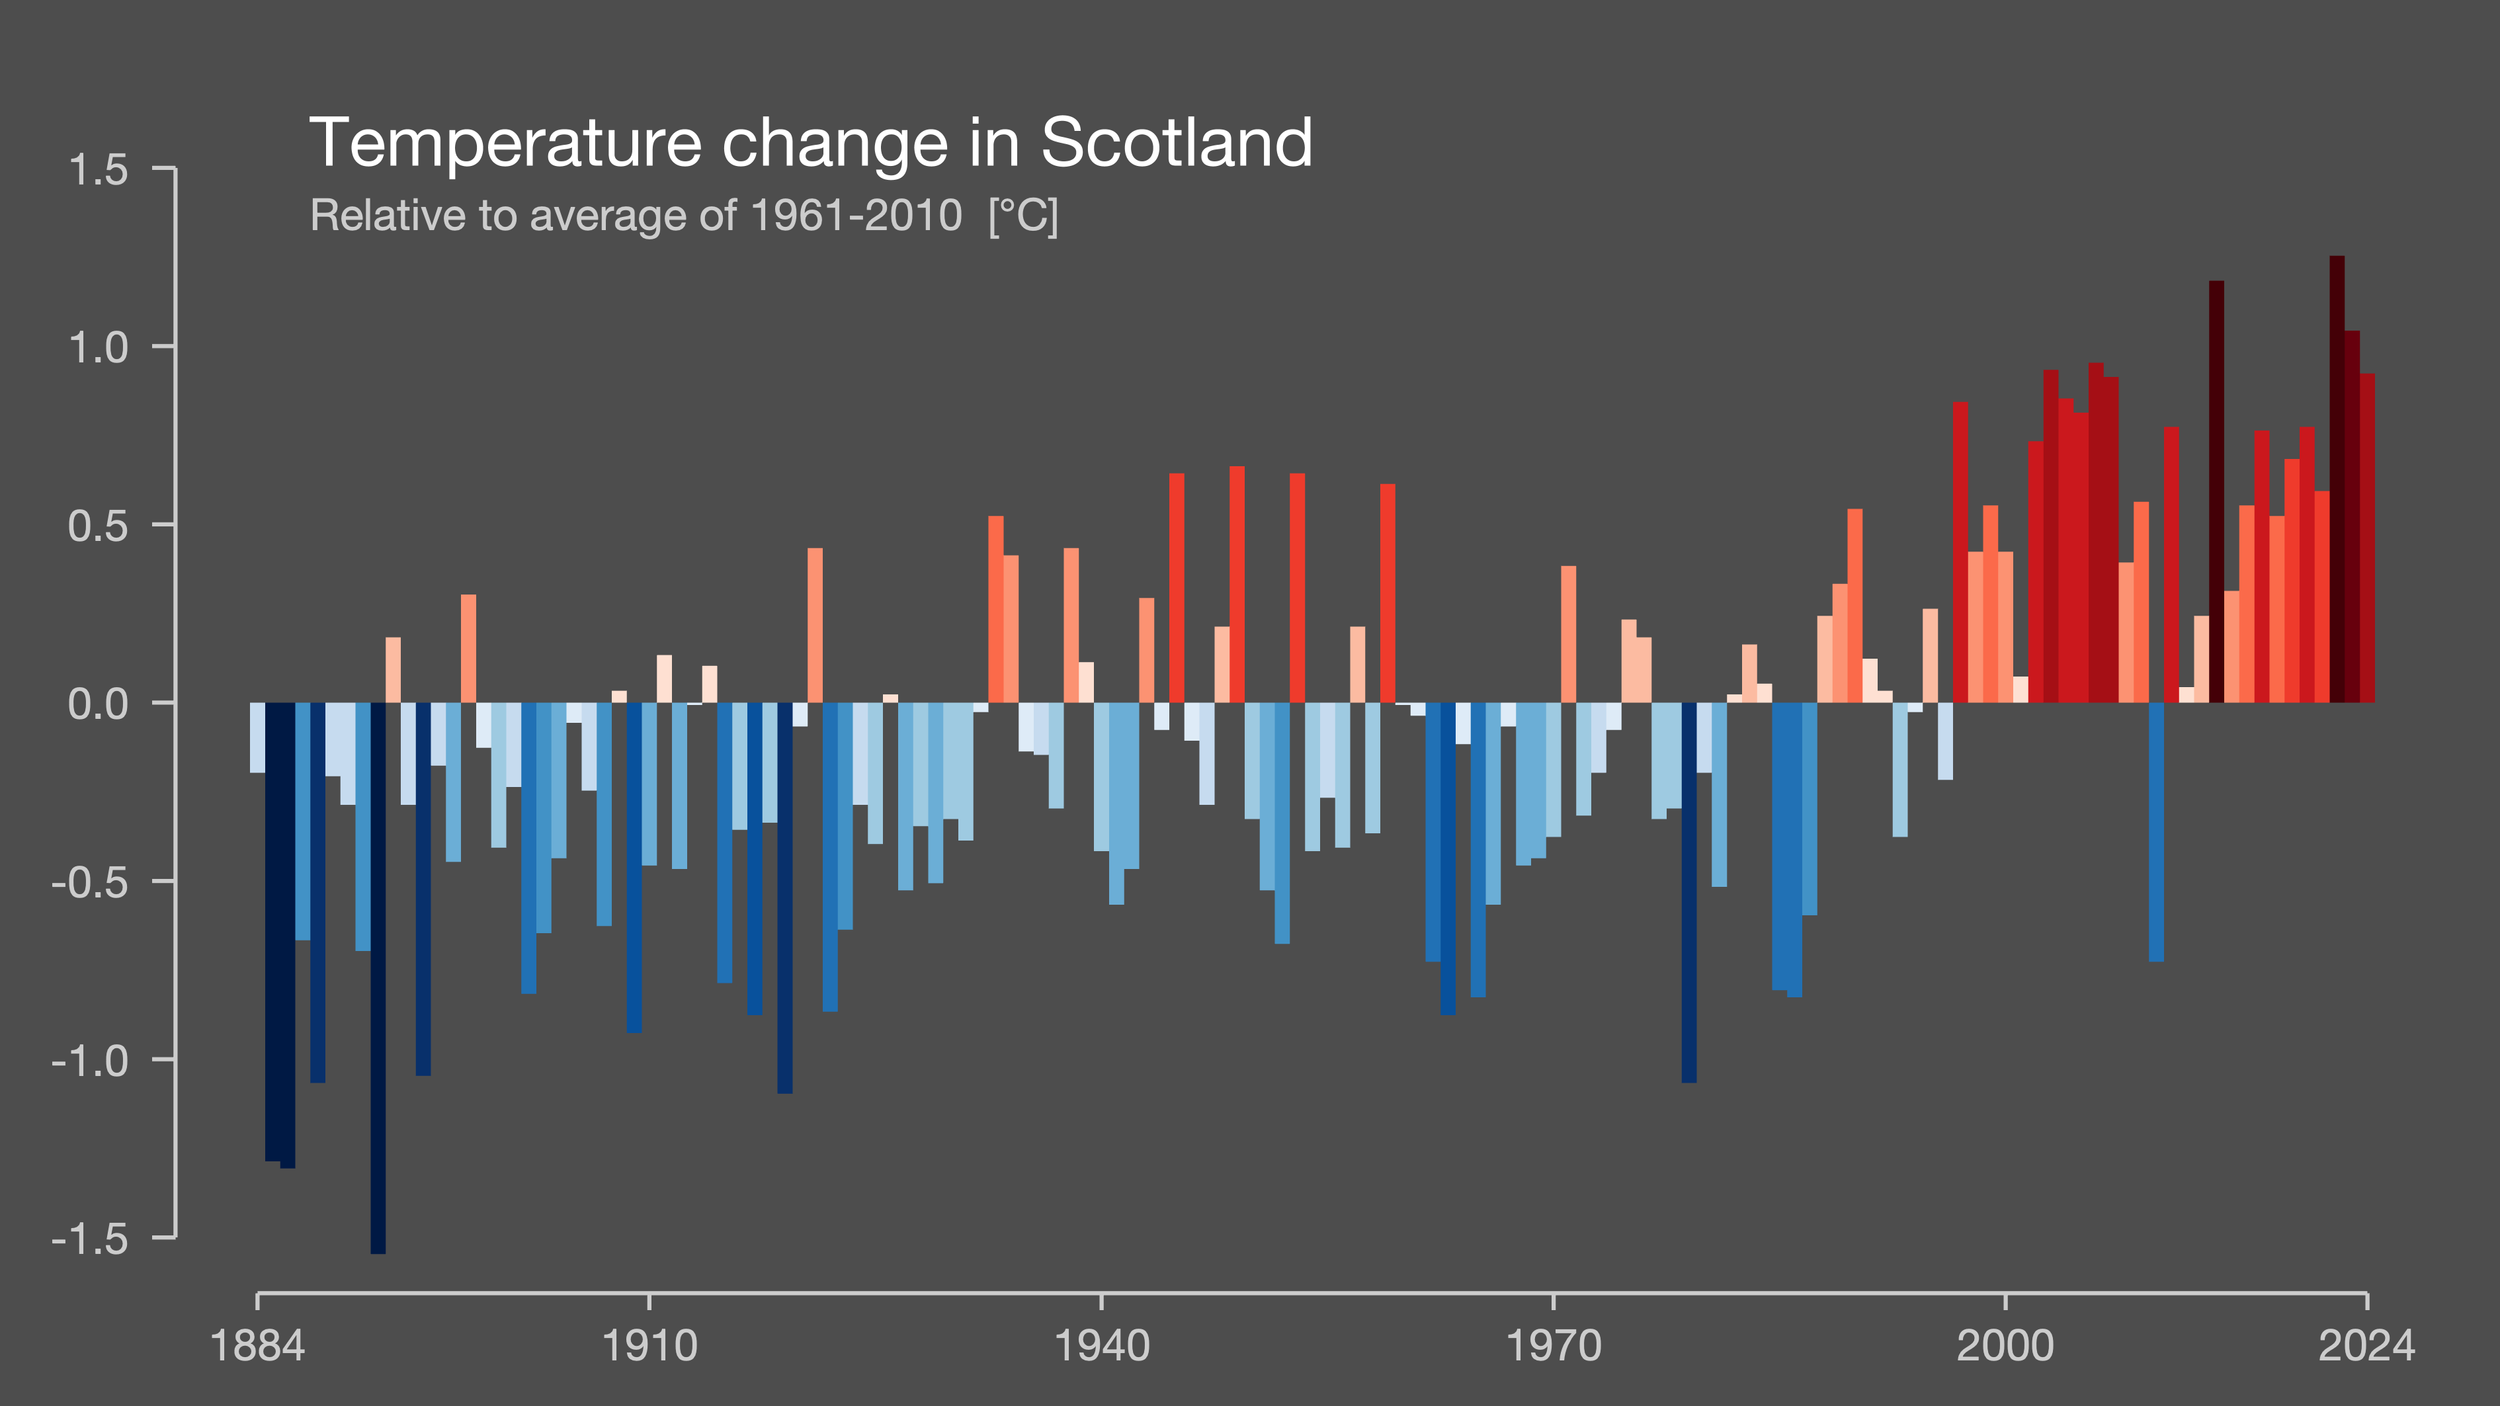
Have you ever seen the Climate Stripes? These stripes show the average, high or low temperatures from 1884 to 2023. The white lines are the average, normal temperature that we’d expect to have seen in pre-industrial times. The blue stripes are when we’re seeing lower-than-average temperatures. But kind of shockingly, the red lines are when we’re seeing higher-than-normal temperatures. These stripes tell a story, and it’s pretty scary to read.
UN Climate Change Executive Secretary, Patricia Espinosa, has provided a wonderful, if frightening, quote to explain Climate Change: “Climate change doesn’t care if we’re left wing, right wing, or in the centre. It doesn’t care who is the prime minister of what country, whether you were born in this generation or the last, what your race is, or how much money you make. It’s coming all the same. It’s already here. And it’s a global emergency.